Basics of biomechanics and bioacoustics
Oscillations and waves
Periodic motion is any motion that reapeats itself in egual intervals of time.
The uniformly rotating earth represents a periodic motion that reapeats itself every 24 hours. The moution of the earth around the sun is periodic, repeating itself every 12 months. A vibrating spring and a pendulum also exhibit periodic motion. The period of the motion is defined as the time for the motion to repeat itself. A special type of periodic motion is simple harmonic motion .
Harmonical oscillations
The simplest form of oscillations is harmonical oscillation. Harmonical oscillation is called by force proportial to shift and is directed opposite to shift. It is described by law of sine or cosine
|
|
(1) |
Here S is shift of body from equilibrium state А is amplitude, ![]() is cycled frequency, Т is
period, j0 is
initial phase characterising state of oscillating system in given moment of
time.
is cycled frequency, Т is
period, j0 is
initial phase characterising state of oscillating system in given moment of
time.
Speed of oscillations of body (point) can be calculated as derivative of shift (1) along time
|
|
(2) |
From equation (2) follows that speed of oscillation changes with time. So, oscillating motion changes with acceleration а which can be found differentiating (2) along time
|
|
(3) |
|
|

Changes of S, u and а with time (under harmonical oscillation) are calculated due to equations (1-3) at j0 =0 and are presented in Fig. 1. If only elasticity force is effecting on point.
|
|
(4) |
here к is coefficient of hardness. Hence, due to the second Newton law
|
|
(5) |
or taking into account (1.3) we have
|
|
(6) |
|
|
|
Denoting by ![]() , we get differential equation of wave
, we get differential equation of wave ![]()
Solution of this equation is
function ![]() shif depending on time
shif depending on time
|
|
|
Decay oscillations
Since inside of oscillating system rubbing force is already present, then harmonical oscillations will decay and will be over in time. At small speeds of motion we may assume that rubbing force is propotional to body speed
|
|
(7) |
where r – is coefficient of environment resistance. Then second Newton law can be written
|
|
(8) |
Denoting ![]() =
=![]() ,
(
,
(![]() is decay coefficient) we get
differential equation of decay oscillations
is decay coefficient) we get
differential equation of decay oscillations
|
|
(9) |
which solution is function S(t):
|
|
(10) |

Fig. 2
where ![]() .
.
Dependence of change of amplitude with time has form
|
|
(11) |
And graphically is shown in fig. 2
Period of decay oscillations is defined by formular
|
|
(12) |

Ratio of two nearest
amplitudes divided by time interval equal to oscilations period is called decay
decrement and is denoted by letter delta ![]() :
:
|
|
(13) |
In practice more often there
is used logarithmic decrement ![]() ,
,
Which is due to definition
|
|
(14) |

Peturbed oscillations
Peturbed oscillations are oscillations caused in system by external force changed by periodical law.
If material point is effected by external peturbing force (except quasi-elastic force and rubbing force)
|
|
(15) |
where ![]() F0
is amplitude,
F0
is amplitude, ![]() is circuled frequency of peturbing force then the second Newton law has form
is circuled frequency of peturbing force then the second Newton law has form
|
|
(16) |
or
|
|
(17) |
where ![]() .
.
Solution of this equation is
|
|
(18) |
Here
|
|
(19) |
 ,
,
Resonance circuled frequency for which shift reaches meximal amplitude is defined by formular
|
|
(20) |
Amplitude at resonance is equal to
|
|
(21) |

Dependence of oscillation amplitude and density is presented on fig.3.

Fig. 3 |
At extenal mechanical oscillations, resonance oscillations are in internal organs too. This is one of the reasons of negative influence of infrasound oscillations and vibrations on human organism.
There is oscillation systems supporting oscillation systems of their own frequency. Such systems are called autooscillationg and their oscillations are called autooscillations.
Mechanical waves
Process of oscillations in elastical environment is called wave. Mechanical wave is mechanical peturbations extended by space and transmitting energy.
They differ two basic kinds of mechanical waves. They are elastic wave (extension of elastic deformations) and waves on fluid surface.
In any point situated in distance х from the first one in direction of wave extension change of value S is
executed by harmonical law but with time delay ![]() ,
where v is
speed of wave extension.
,
where v is
speed of wave extension.
Let’s write equation of flat wave
|
|
(22) |
Executing transformation mentioned below
|
|
(23) |
|
|
(24) |
we get differential equation of wave
|
|
(25) |
Hooke's law
Hooke's law accurately models the physical properties of common mechanical springs for small changes in length. Hooke's law describes how far the spring will stretch with a specific force.

In mechanics, and physics, Hooke's law of elasticity is an approximation that states that the extension of a spring is in direct proportion with the load applied to it. Many materials obey this law as long as the load does not exceed the material's elastic limit. Materials for which Hooke's law is a useful approximation are known as linear-elastic or "Hookean" materials. Hooke's law in simple terms says that strain is directly proportional to stress.
Mathematically, Hooke's law states that
![]()
Where
x is the displacement of the end of the spring from its equilibrium position (in SI units: "m");
F is the restoring force exerted by the material (in SI units: "N" or kgms-2); and k is a constant called the rate or spring constant (in SI units: "N·m-1" or "kgs-2").
When this holds, the behavior is said to be linear. If shown on a graph, the line should show a direct variation. There is a negative sign on the right hand side of the equation because the restoring force always acts in the opposite direction of the displacement (for example, when a spring is stretched to the left, it pulls back to the right). Hooke's law is named after the 17th century British physicist Robert Hooke. He first stated this law in 1660 as a Latin anagram,[1] whose solution he published in 1678 as Ut tensio, sic vis, meaning, "As the extension, so the force".
Elastic. Objects that quickly regain their original shape after being deformed by a force, with the molecules or atoms of their material returning to the initial state of stable equilibrium, often obey Hooke's law.
We may view a rod of any elastic material as a linear spring. The rod has length L and cross-sectional area A. Its extension (strain) is linearly proportional to its tensile stress σ, by a constant factor, the inverse of its modulus of elasticity, E, hence,
![]() or
or ![]()
Hooke's law only holds for some materials under certain loading conditions. Steel exhibits linear-elastic behavior in most engineering applications; Hooke's law is valid for it throughout its elastic range (i.e., for stresses below the yield strength). For some other materials, such as aluminium, Hooke's law is only valid for a portion of the elastic range. For these materials a proportional limit stress is defined, below which the errors associated with the linear approximation are negligible. Rubber is generally regarded as a "non-hookean" material because its elasticity is stress dependent and sensitive to temperature and loading rate. Applications of the law include spring operated weighing machines, stress analysis and modelling of materials.
The spring equation
Stress–strain curve for
low-carbon steel. Hooke's law is only valid for the
portion of the curve between the origin and the yield point(2).
1. Ultimate strength

2. Yield strength - corresponds to yield point
3. Rupture
4. Strain hardening region
5. Necking region
A: Apparent stress (F/A0)
B: True stress (F/A)
The most commonly encountered form of Hooke's law is probably the spring equation, which relates the force exerted by a spring to the distance it is stretched by a spring constant, k, measured in force per length.
![]()
The negative sign indicates that the force exerted by the spring is in direct opposition to the direction of displacement. It is called a "restoring force", as it tends to restore the system to equilibrium. The potential energy stored in a spring is given by
![]()
which comes from adding up the energy it takes to incrementally compress the spring. That is, the integral of force over distance. (Note that potential energy of a spring is always non-negative.)
This potential can be visualized as a parabola on the U-x plane. As the spring is stretched in the positive x-direction, the potential energy increases (the same thing happens as the spring is compressed). The corresponding point on the potential energy curve is higher than that corresponding to the equilibrium position (x = 0). The tendency for the spring is to therefore decrease its potential energy by returning to its equilibrium (unstretched) position, just as a ball rolls downhill to decrease its gravitational potential energy.
If a mass m is attached to the end of such a spring, the system becomes a harmonic oscillator. It will oscillate with a natural frequency given either as an angular frequency
 or as a natural
frequency
or as a natural
frequency 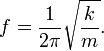
Multiple springs
When two springs are attached to a mass and compressed, the following table compares values of the springs.
|
Comparison |
In Parallel |
In Series |
|
|
|
|
|
Equivalent |
|
|
|
Compressed |
|
|
|
Energy |
|
|


Energy density. Vector of Umov
Waves transmit energy. Energy quantity per environment volume is called energy density
|
|
(26) |
Elastic wave (when oscillations of the environment partices cause oscillations of the nearest ones) transmit total energy
|
|
(27) |
Energy density
|
|
(28) |
![]() is environment density.
is environment density.
So, energy density is
|
|
(29) |
To characterise wave energy they use such physical quantities as flow of wave energy and intensity of wave energy.
Flow of wave energy is quantitative characteristic of energy transmitted which is equal to ratio of energy dE transmitted by waves through surface to time dt during which it is transmitted
|
|
(30) |
Unit of the flow of wave energy in system SI is Wat(Wt).
Energy of wave intensity numerically is equal to flow of wave energy transmitted through unit square
|
|
(31) |
Unit of energy intensity is Wt/м![]() .
.

Let’s find relation between wave energy flow of oscillating points and speed of wave extension. Let’s mark environment volume where waves are extended in the form of right-angle parallelepiped (fig.5); with base S, with edge length V, which has the same direction as wave extension. Per 1 second through parallelepiped base there is transmitted such ammount of energy that particles in volume of parallelogram Sv have. This is flow of wave energy.
|
|
(32) |
Then
|
|
(33) |
Vector І showing direction of wave extension and equal to flow of wave energy passing through unit area perpendicular to this direction is called Umov vector. Umov vector for elastic force depends on environment density, squared amplitude of particles oscillation, squared oscillation frequency and speed of wave extension.
Intensity of flat wave is connected with sound pressure by relation
|
|
(34) |

where ![]() is environment density, с is
sound speed. Product of sound speed с in given environment and environment density
is environment density, с is
sound speed. Product of sound speed с in given environment and environment density ![]() is called specific acustic resistance of environment
is called specific acustic resistance of environment ![]() с
and is basic characteristic of acustic properties. For
air (in normal conditions)
с
and is basic characteristic of acustic properties. For
air (in normal conditions) ![]()
The Acoustic harmonious spectrum is a result of decomposition of complex fluctuation (tone) on simple tones (harmonics) which make it, with their frequencies and amplitude .
With physical (objective) characteristics of a sound physiological (subjective) characteristics of a sound are closely connected. This connection is illustrated by the circuit given on fig 1
At clinical researches measure a threshold of acoustical sensation I0 as which understand intensity of a sound of the given frequency which is still perceived by an ear (or the minimal sound pressure). The normal human ear perceives rather wide range intensivety of a sound:
So on frequency 1000 Hz from (a threshold of acoustical sensation) to I = 10 W/m2 (a threshold of painful sensation). The attitude of these intensivety equal 1013, therefore for convenience enter a scale of a level of intensity. The scale of a level intensivety a sound is created thus: value I0 is accepted for an initial level of a scale, any other intensity express through the decimal logarithm of its attitude to I0:
![]()
For unit of a level of intensity it is accepted 1Bell (B) which answers change of intensity in 10 times, and also 1decBell (dБ) =0,1
![]()
For a physiological estimation of loudness of a sound enter a scale of a level of loudness LE. At constant frequency a level of loudness connected to a level of intensity law Veber-Fishner, according to which level of loudness on the given frequency proportional to a level of intensity:
![]()
![]()
That is, if intensity of a sound will change in a geometrical progression (that is in identical number of times) the level of loudness will change in an arithmetic progression (that is, on identical size); k-factor of proportionality which depends on frequency and intensity . Concerning a sound it means, that if intensity of a sound accepts a number of consecutive values, for example a, a2I, a3I (and - some factor, а > 1) relative it the sensation of loudness of a sound will be E0, 2E0, 3E0 etc. If the factor k was a constant the scale intensity would answer a scale of loudness.
Consider, that on frequency 1000 Hz scales of a level of loudness and a level of intensity of a sound coincide. That is (k=1) on this frequency of decibels of a scale of a level of intensity will answer decibel of a scale of a level of loudness. For difference of a scale of intensity from a scale of loudness of decibels name a background.
Dependence of a level of intensity of a sound on frequency which is perceived by a human ear as a sound of identical loudness with a sound on frequency 1000 Hz refers to as as a curve of a level of loudness. The curve of a zero level of loudness (a threshold of acoustical sensation) which gives dependence I0 on frequency has the important value.
At deterioration of hearing the curve to a threshold of acoustical sensation will be located the supreme from normal.
On each frequency the difference of a level of intensity in a pathology and norm answers a difference of a level of loudness, that is sensation of the same sound in norm and pathologies. This difference in norm and pathologies refers to as as loss of hearing. Loss of hearing is decrease of a level of loudness perception the patient of a sound of the given frequency (a level intensity) in relation to norm .Loss hearing is accepted to estimate on increase of a level of intensity in comparable with norm. As research will be carried out on equal to a threshold of acoustical sensation the method refers to as threshold and as measurement will be carried out on precisely certain frequency the method refers to as voice-frequency.
Thus the method voice-frequency threshold audiometry is a reception of research of hearing of the patient which is based on definition of loss of hearing on increase of a level of intensity which answers a level of acoustical sensation in comparison with norm. For an estimation of loss of hearing to be under construction audiogram. Audiogram is a diagram, which show loss of hearing in decibels on frequency oscillation. The block diagram of audiometer is given on rice 2.
Т - the phone, k1 - the switch of intensity of masking noise, k2 - the switch and the button of submission of tone.
In the robot for removal audiogrammes use audiometer polyclinic АП-02.
Audiometer АП-02 generates frequencies clean tones: 125, 250, 500, 100, 2000, 3000, 4000, 6000, 8000 Hz. Change of a level of intensity is made discretely through (5,0±dB.1,5) Zero position scales “ Drop hearing, dB” for all frequencies answers a threshold of acoustical sensation.
Research of hearing
Acoustical analyzers are closely connected among themselves as in anatomical, and is functional. For this reason the frustration of balance frequently are combined with those or other infringements of acoustical function. The numerous tests for revealing infringements of the acoustical analyzer are developed. The most important test is voice-frequency threshold audiometry - the research of thresholds of hearing on various frequencies. The research will be carried out in a special cabin or saund isolate a premise. Through headphones or telephones for inswide of ear the doctor shows to the patient sounds of various frequency and loudness. The patient, in turn, pressing on the button, informs to the doctor that the sound is heard. On the following investigation phase the sound moves not through headphones, and through, so-called, bone the vibrator, available on foreheard or on bone for by ear. Results of research the doctor puts on audiogram. The vertical lines on audiogram designate sound frequencies, horizontal lines - intensity of a sound in dB (fig. 1). The research has no contra-indications and complications, 20-40 mines last usually.


Fig. 7. Normal audiogram

Fig.8. Acoustic stem the caused potentials
Acoustic impedansmetry is applied at differential diagnostics of diseases average of ear and to reception of representation about a functional condition VII and VIII of pairs skull-cerebral of nerves and trunk of a brain. At this research in ear of the patient is inserted special cork, connected with the device – impedance meter, through which in outside acoustical pass the negative or positive pressure is created, and also the various sounds move. Duration of research - 10-20 mines. Research of the acoustic caused potentials of a brain.
At this kind of research the answer of a brain to sound stimulus is registered.
As stimulus the short acoustic clicks submitted through headphones are used. The change of potentials of a brain is registered by special electrodes fixed on a skin of a head of the patient, and is transferred to the computer. The answer consists of a complex of positive peaks designated by way of their occurrence in the Roman figures (a fig. 8). These peaks reflect passage of acoustical signals in the appropriate departments of an acoustical path. At the present moment the sources of generation of peaks are established with the large degree of reliability. As the various diseases of a brain change these potentials, the method enables to look after localization of these infringements.
Duration of research 30-40 mines.
Electrocoxleogrphy is used for diagnostics of condition accompanying Endolimphatic gidrops, and represents registration of the electrical answer internal of ear on sound stimulus.
After a toilet of outside acoustical pass (distance sulfuric corc) in outside acoustical pass the special electrode is entered. The stimulus move on researched ear through headphones or special inswide of earthe stitches - in - isert In rest the method reminds registration acoustic stem of the caused potentials. The registered answer allows judging presence or absence Endolimphatic gidrops and about a functional conditioning a snail.

Perception of Sound - Human Ear
This is a cross-sectional view of our ear showing the major parts for hearing:
The ear comprises of three parts :
(a) the outer or external ear,
(b) the middle ear, and
(c) the inner ear
Let us see how the different parts of the ear work together to enable hearing. Please click on the demo button to read the details.
Traveling Waves
Sound is produced when something vibrates. The vibrating body causes the medium (water, air, etc.) around it to vibrate. Vibrations in air are called traveling longitudinal waves, which we can hear. Sound waves consist of areas of high and low pressure called compressions and rarefactions, respectively. Shown in the diagram below is a traveling wave. The shaded bar above it represents the varying pressure of the wave. Lighter areas are low pressure (rarefactions) and darker areas are high pressure (compressions). One wavelength of the wave is highlighted in red. This pattern repeats indefinitely. The wavelength of voice is about one meter long. The wavelength and the speed of the wave determine the pitch, or frequency of the sound. Wavelength, frequency, and speed are related by the equation speed = frequency * wavelength. Since sound travels at 343 meters per second at standard temperature and pressure (STP), speed is a constant. Thus, frequency is determined by speed / wavelength. The longer the wavelength, the lower the pitch. The 'height' of the wave is its amplitude. The amplitude determines how loud a sound will be. Greater amplitude means the sound will be louder.
What is a wave?
A wave is a pulse of energy. Waves carry energy away from a central transmitter. Mechanical waves, such as sound waves, need some medium of transmission. Electromagnetic waves, for example radio waves, can carry energy through a vacuum. If a wave is travelling through a medium, the particles of the medium do not move along with it. They vibrate about their equilibrium position, and the energy is transmitted through the interaction of neighbouring particles. Here is a Maple program that plots a simple travelling sine wave. It is animated so that you can see the wave motion along the axis. The dots represent particles in the medium. If you watch the line of dots closest to the vertical axis, you will see that they oscillate up and down, but do not move with the wave.

Fig.10
Imagine a long rope stretched out straight along the ground. If you vibrate one end periodically, then a transverse wave will move along it. A snapshot would look like this:

Fig.11
The line through BH gives the equilibrium or rest position.
The amplitude A measures the maximum displacement of a particle from equilibrium: “rest to crest”. The amplitude is related to the amount of energy the wave is carrying.
The wavelength measures the length of one complete cycle.
The period is the time a particle on the rope takes to do one cycle.
The frequency is the number of cycles a particle makes/unit time.
The mathematical functions that model periodic behaviour with a constant amplitude and wavelength are sines and cosines.
Electromagnetic Spectrum
|
Spectrum of Electromagnetic Radiation |
||||
|
Regions |
Wavelength (Angstroms) |
Wavelength (meters) |
Frequency (Hz) |
Energy (eV) |
|
Radio |
greater than 109 |
greater than 1 |
less than 3 x 10⁹ |
less than 10-5 |
|
Microwave |
109 - 106 |
0.1 - 0.01 |
3 x 10⁹ - 3 x 10¹² |
10-5 - 0.01 |
|
Infrared |
106 - 7000 |
0.0001 - 7 x 10⁻⁷ |
3 x 10¹² - 4.3 x 10¹⁴ |
0.01 - 2 |
|
Visible |
7000 - 4000 |
7 x 10⁻⁷ - 4 x 10⁻⁷ |
4.3 x 10¹⁴ - 7.5 x 10¹⁴ |
2 - 3 |
|
Ultraviolet |
4000 - 10 |
4 x 10⁻⁷ - 10-9 |
7.5 x 10¹⁴ - 3 x 10¹⁷ |
3 - 103 |
|
X-Rays |
10 - 0.1 |
10-9 - 10-11 |
3 x 10¹⁷ - 3 x 10¹⁹ |
103 - 105 |
|
Gamma-Rays |
less than 0.1 |
less than 10-11 |
greater than 3 x 10¹⁹ |
greater than 105 |
The Doppler effect (or Doppler shift), named after Austrian physicist Christian Doppler who proposed it in 1842, is the change in frequency of a wave for an observer moving relative to the source of the wave. It is commonly heard when a vehicle sounding a siren or horn approaches, passes, and recedes from an observer. The received frequency is higher (compared to the emitted frequency) during the approach, it is identical at the instant of passing by, and it is lower during the recession.
The relative increase in frequency can be explained as follows. As the source of frequency emission (train for eg.) moves toward the observer, there forms a compression for the frequency between the source and the observer reducing the length of the waves which in effect increase the frequency and in turn the pitch.
For waves that propagate in a medium, such as sound waves, the velocity of the observer and of the source are relative to the medium in which the waves are transmitted. The total Doppler effect may therefore result from motion of the source, motion of the observer, or motion of the medium. Each of these effects is analyzed separately. For waves which do not require a medium, such as light or gravity in general relativity, only the relative difference in velocity between the observer and the source needs to be considered.
Development
Doppler first proposed the effect in 1842 in his treatise "Über das farbige Licht der Doppelsterne und einiger anderer Gestirne des Himmels" (On the coloured light of the binary stars and some other stars of the heavens).[1] The hypothesis was tested for sound waves by Buys Ballot in 1845. He confirmed that the sound's pitch was higher than the emitted frequency when the sound source approached him, and lower than the emitted frequency when the sound source receded from him. Hippolyte Fizeau discovered independently the same phenomenon on electromagnetic waves in 1848 (in France, the effect is sometimes called "effet Doppler-Fizeau"). In Britain, John Scott Russell made an experimental study of the Doppler effect (1848).[2]

An English translation of Doppler's 1842 treatise can be found in the book The Search for Christian Doppler by Alec Eden.[1]
General
In classical physics, where the speeds of source and the receiver relative to the medium are lower than the velocity of waves in the medium, the relationship between observed frequency f and emitted frequency f0 is given by:
![]()
where
![]() is the velocity of waves in the medium
is the velocity of waves in the medium
![]() is the velocity of the receiver relative to the medium; positive
if the receiver is moving towards the source.
is the velocity of the receiver relative to the medium; positive
if the receiver is moving towards the source.
![]() is the velocity of the source relative to the medium; positive
if the source is moving away from the receiver.
is the velocity of the source relative to the medium; positive
if the source is moving away from the receiver.
Temperature measurement
Another use of the Doppler effect, which is found mostly in plasma physics and astronomy, is the estimation of the temperature of a gas (or ion temperature in a plasma) which is emitting a spectral line. Due to the thermal motion of the emitters, the light emitted by each particle can be slightly red- or blue-shifted, and the net effect is a broadening of the line. This line shape is called a Doppler profile and the width of the line is proportional to the square root of the temperature of the emitting species, allowing a spectral line (with the width dominated by the Doppler broadening) to be used to infer the temperature.
Radar
Main article: Doppler radar
The Doppler effect is used in some types of radar, to measure the velocity of detected objects. A radar beam is fired at a moving target — e.g. a motor car, as police use radar to detect speeding motorists — as it approaches or recedes from the radar source. Each successive radar wave has to travel farther to reach the car, before being reflected and re-detected near the source. As each wave has to move farther, the gap between each wave increases, increasing the wavelength. In some situations, the radar beam is fired at the moving car as it approaches, in which case each successive wave travels a lesser distance, decreasing the wavelength. In either situation, calculations from the Doppler effect accurately determine the car's velocity. Moreover, the proximity fuze, developed during World War II, relies upon Doppler radar to explode at the correct time, height, distance, etc.
Medical imaging and blood flow measurement
An echocardiogram can, within certain limits, produce accurate assessment of the direction of blood flow and the velocity of blood and cardiac tissue at any arbitrary point using the Doppler effect. One of the limitations is that the ultrasound beam should be as parallel to the blood flow as possible. Velocity measurements allow assessment of cardiac valve areas and function, any abnormal communications between the left and right side of the heart, any leaking of blood through the valves (valvular regurgitation), and calculation of the cardiac output. Contrast-enhanced ultrasound using gas-filled microbubble contrast media can be used to improve velocity or other flow-related medical measurements.
Although "Doppler" has become synonymous with "velocity measurement" in medical imaging, in many cases it is not the frequency shift (Doppler shift) of the received signal that is measured, but the phase shift (when the received signal arrives).
Velocity measurements of blood flow are also used in other fields of medical ultrasonography, such as obstetric ultrasonography and neurology. Velocity measurement of blood flow in arteries and veins based on Doppler effect is an effective tool for diagnosis of vascular problems like stenosis.
Flow measurement
Instruments such as the laser Doppler velocimeter (LDV), and acoustic Doppler velocimeter (ADV) have been developed to measure velocities in a fluid flow. The LDV emits a light beam and the ADV emits an ultrasonic acoustic burst, and measure the Doppler shift in wavelengths of reflections from particles moving with the flow. The actual flow is computed as a function of the water velocity and face. This technique allows non-intrusive flow measurements, at high precision and high frequency.
The physical properties of pure-tone audiometry
The ear (the auditory analyzer) is the organ of perception and analysis of environmental oscillations. In the course of the evolution, the human organ of hearing has developed a complicated structure that is able to perceive sound vibrations with a frequency ranging from about 16 to 20000 oscillations per second (hertz). The number of auditory stimuli perceived by the cerebral cortex is really numerous and diverse. The human ear can detect the differences in the pitch, loudness and timbre of the sound as well as the direction and the distance of the sound wave to the sound source. In the course of life the abilities of the ear change greatly i.e. the perception of high-pitched sounds worsens at the disorders of the receptor cells as the result of age degeneration or pathological processes.
The key hearing test used to identify hearing threshold levels of an individual, enabling determination of the degree, type and configuration of a hearing loss is called pure tone audiometry. The hearing threshold and its dependence on sound frequency serve as the important diagnostic factor for localizing pathologic changes in the ear and understanding diverse diagnostic procedures: auscultation, percussion, phonocardiography and the infrasound and noise influence on the human organs.
The objectives of the laboratory work:
To learn the functional purpose and the operating instructions of the audiometer Sound Generate. To identify experimentally hearing threshold levels of a patient at the different hearing frequency with the audiometer Sound Generate.
The laboratory equipment and materials :
A personal computer, the audiometer Sound Generate, audiogram forms, earphones Sven GD-750.
THEORETICAL BACKGROUND
The perception of sound in any organism is limited to a certain range of frequencies. For humans, hearing is normally limited to frequencies between about 16 Hz and 20,000 Hz. Sound waves are produced by a vibrating body (e.g. a tuning fork, string). Sounds are divided into tones, noise and sonic boom. There are also pure and complex tones. A pure tone is a sound that consists of one single frequency and is created if a simple harmonic oscillator emits sound waves. A complex tone is a sound wave that repeats with a given pattern but the pattern is not a sine wave. The complex tone consists not only of one frequency sine wave but rather a number of different frequency sine waves superimposed on top of one another. A pure tone is created by a tuning fork while complex tones are those produced by the human voice or musical instruments. According to Fourier's theorem, a complex tone consists of two or more simple tones, called overtones. The tone of lowest frequency is called the fundamental; the others, overtones. Sounds are characterized by the following generic properties:
The intensity of a sound wave is the energy per unit time that it is transported by the wave, per unit area of wave front:
![]() (1)
(1)
where r– the density of a medium, ![]() -
the speed of the wave, w - the cyclic frequency, А
– the amplitude of the wave. The formula (1) states
that the square of the amplitude
of the wave is directly proportional to the intensity of the sound.
-
the speed of the wave, w - the cyclic frequency, А
– the amplitude of the wave. The formula (1) states
that the square of the amplitude
of the wave is directly proportional to the intensity of the sound.
Sound pressure or acoustic pressure is the local pressure deviation from the ambient (average, or equilibrium) atmospheric
pressure caused by a sound
wave. The
intensity of a sound wave is equal to the square of the amplitude of the
acoustic pressure divided by ![]() and
is mathematically represented by the following formula:
and
is mathematically represented by the following formula:
![]() (2)
(2)
where
![]() -
acoustic impedance, Р - the acoustic
pressure.
-
acoustic impedance, Р - the acoustic
pressure.
An acoustic harmonic spectrum is a spectrum containing only frequency components whose frequencies are whole number multiples of the fundamental frequency; such frequencies are known as harmonics.
The physical (objective) characteristics of a sound are closely connected with the physiological (subjective) characteristics of a sound (See Figure 1).
The threshold of hearing I0 , which is the minimum sound level of a pure tone that an average ear with normal hearing can hear with no other sound present, is detected in the clinical researches. A normal human ear can detect sounds with the wide range of intensities:

The ear
has incredible sensitivity from the frequency of 1000 Hz ![]() (threshold of hearing ) to I= 10 W/m2 (threshold of pain ).
(threshold of hearing ) to I= 10 W/m2 (threshold of pain ).
Since the range of intensities that the human ear can detect is so large, the scale that is frequently used by physicists to measure intensity is a scale based on multiples of 10. This type of scale is sometimes referred to as a logarithmic scale. The scale for measuring intensity is the decibel scale:
![]() (3)
(3)
The SI unit of sound intensity level is 1 Bel corresponding to an intensity ratio of 10 to 1 as well as 1 decibel (dB) =0,1 Bel
![]() (4)
(4)
The scale of loudness is used to evaluate the sound loudness LE. At the constant frequency the level of loudness correlates with the level of intensity according to the Weber-Fechner Law i.e. the level of loudness of specified frequency is proportional to the level of intensity:
![]() (5)
(5)
thus, if the sound intensity changes in the geometric progression (by the common ratio), then the level of sound loudness changes in the arithmetic progression (where the difference between the consecutive terms is constant); k- the constant of proportionality that depends on frequency and intensity. If the sound intensity has the form of a geometric sequence, e.g. aI, a2I, a3I (а – a constant, а>1), then the corresponding level of sound loudness is Е0, 2Е0, 3Е0 etc. If the constant k were stable, the scale of intensities would correspond to the scale of loudness.
The scales of sound intensity and sound loudness are said to coincide at the frequency 1000 Hz, thus (k=1) at this frequency the decibel of the scale of intensity will correspond to the decibel of the scale of loudness. A unit of apparent loudness, equal in number to the intensity in decibels of a 1,000-hertz tone perceived to be as loud as the sound being measured is called a phon.
An equal-loudness contour is a measure of sound pressure over the frequency spectrum, for which a listener perceives a constant loudness when presented with pure steady tones. The zero phon curve (threshold of hearing) plays a significant role and shows the dependence of I0 on frequency.
The hearing threshold curve runs higher than normal at hearing disorders.
At every frequency the difference of the intensity level corresponds to the difference of the loudness level in normal and pathologic conditions. This difference in normal

pathologic conditions is called hearing loss. Hearing loss is the decrease of perception of the loudness level of a sound of a specified frequency (intensity level) by a patient. Hearing loss is assessed by the increase of intensity level comparing to the norm. The methods performed at the threshold of hearing are called threshold methods while the methods performed at a specified frequency are called tone methods.
Thus, the method of pure tone audiometry is the measurement of the range and sensitivity of a person's sense of hearing. An audiogram is a graph that shows the softest sounds a person can hear at different pitches or frequencies. The scheme of an audiometer is shown in Figure 2.
Т – telephone, к1 – the switch of the intensity of masking signals, к2 – the switch and the stimulus button.
The sound generator Sound Generate is used during laboratory classes.
The audiometer Sound Generate generates pure tones of frequencies: 125, 250, 500, 100, 2000, 3000, 4000, 6000, 8000 Hz. The change of the intensity level is performed discretely in 5±1,5dB. The zero position of the scale “Hearing impairment” corresponds to the threshold of hearing.
The instructions of the laboratory work
1. Run the program Sound Generate by pressing: "START-Programs-18_10_11-Sound_Generate. Press the Stop button when done (Figure 1)


Fig. 1 The module of the program Sound Generate.
1-the start button.
2-the button of the stop of the signal generation.
3-the volume control pointer.
4-the window of the frequency of a generated sound.
5- the window of the frequency of impulse generation.
6-the window of the graphic representation of a generated sound.
2. Run the program Master Volume on the taskbar(Fig. 3) double-clicking the left button of the mouse on the pictogram 1 (Fig. 2) and put the pointer of the balance control in the far-left position.
 |
Figure 2. The pictogram of running the program Master Volume

Figure 3. The window of the program Master Volume.
1-balance control.
3.  Put on the headphones on the patient (make sure that the pointer of the volume control is in the position of the maximal loudness Fig.3), set
the frequency 1000 Hz in the window 4 in Figure 1 and put the volume pointer 3 in the minimal position.
Put on the headphones on the patient (make sure that the pointer of the volume control is in the position of the maximal loudness Fig.3), set
the frequency 1000 Hz in the window 4 in Figure 1 and put the volume pointer 3 in the minimal position.

Fig.3 The headphones Sven GD-750.1-volume control.
4. Gradually increase the volume until the patient perceives the sound clearly.
5. Find the position of the volume control that corresponds to the threshold of hearing. Using Table 1 calculate the percent value of loudness in decibels (dB) that corresponds to the threshold of hearing. Put a full stop on the audiogram form in your exercise books.
6. Repeat the mentioned above procedure at the different frequencies. The following sequence of the frequency alteration is recommended in the clinical researches: 1000 ,2000 , 3000 , 4000 , 8000 , 500 , 250 , 125 Гц .
7. Connect the points corresponding to the threshold levels at different frequencies with a line receiving the audiogram of the ear.
8. Repeat the experiment on the other ear putting the balance control in the different position.
9. After listening to the fragment of the music file “” during 2 minutes repeat steps 3-8.
10. After listening to the fragment of the music file “Water-1” during 2 minutes repeat steps 3-8.
11. Calculate the dependence ![]() and show it as a graph.
Calculate the intensity with the following formula:
and show it as a graph.
Calculate the intensity with the following formula:![]()
where I 0 - intensity that corresponds to the threshold of hearing (I0
=10-12 W/m2 ),![]() - hearing impairment in dB is shown
on the audiogram.
- hearing impairment in dB is shown
on the audiogram.
12.Make a brief outline of the performed experiment mentioning the following:
· Formulate the objectives of the experiment.
· Indicate the maximal and minimal intensity value of the right and left ears and the frequencies where these values are detected.
· Analyze if listening to different kinds of music influence your hearing properties and in what ways they are influenced.
Self-assessment tasks
1. The nature of sounds, types of sounds, physical and physiological sound characteristics, their correlation and dependence.
2. The level of intensity (sound pressure), the level of loudness. Their SI units.
3. The threshold of hearing and its diagnostic significance; threshold of hearing, areas of hearing, equal-loudness contours.
4. Weber-Fechner Law.
5. Hearing impairment, audiometry, audiograms and their significance.
6. The functional purpose and the structure of the audiometer.

The ear has three main parts:
The outer ear (the part you can see) opens into the ear canal. The eardrum separates the ear canal from the middle ear. Small bones in the middle ear help transfer sound to the inner ear. The inner ear contains the auditory (hearing) nerve, which leads to the brain.
Any source of sound sends vibrations or sound waves into the air. These funnel through the ear opening, down the ear, canal, and strike your eardrum, causing it to vibrate. The vibrations are passed to the small bones of the middle ear, which transmit them to the hearing nerve in the inner ear. Here, the vibrations become nerve impulses and go directly to the brain, which interprets the impulses as sound.
The pinna, the outer part of the ear, serves to "catch" the sound waves. It also helps you determine the direction of a sound. Your brain determines the horizontal position of a sound by comparing the information coming from your two ears.
Once the sound waves travel into the ear canal, they vibrate the tympanic membrane or eardrum. This is a thin, cone-shaped piece of skin, about 10 millimeters (0.4 inches) wide. It is positioned between the ear canal and the middle ear. Air from the atmosphere flows in from your outer ear onto one side and from your mouth on the other (the middle ear is connected to the throat via the eustachian tube) so the air pressure on both sides of the eardrum remains equal. This pressure balance lets your eardrum move freely back and forth with even the slightest air-pressure fluctuations. Higher-pitch sound waves move the drum more rapidly (higher frequency), and louder sound moves the drum a greater distance (bigger amplitude). The eardrum is the entire sensory element in your ear. The rest of the ear serves only to pass along the information gathered at the eardrum.
For the most part, the changes in air pressure due to sound waves we hear are extremely small. They don't apply much force on the eardrum, but the eardrum is so sensitive that this minimal force moves it a good distance. However, the cochlea in the inner ear conducts sound through a fluid, instead of through air. This fluid has a much higher inertia than air so the small force felt at the eardrum is not strong enough to move this fluid. Therefore before the sound passes on to the inner ear, the total pressure (force per unit of volume) must be amplified.
This amplification is caried out by the ossicles:
- The malleus - the hammer
- The incus - the anvil
- The stapes - the stirrup
The malleus is connected to the center of the eardrum, on the inner side. When the eardrum vibrates, it moves the malleus from side to side like a lever. The other end of the malleus is connected to the incus, which is attached to the stapes. The other end of the stapes rests against the cochlea, through the oval window.
When air-pressure compression pushes in on the eardrum, the ossicles move so that the stapes pushes in on the cochlear fluid. When air-pressure rarefaction pulls out on the eardrum, the ossicles move so that the stapes pulls in on the fluid. Essentially, the stapes acts as a piston, creating waves in the inner-ear fluid to represent the air-pressure fluctuations of the sound wave.
The ossicles amplify the force from the eardrum in two ways:
The main amplification comes from the size difference between the eardrum and the stirrup. The eardrum has a surface area of approximately 55 square millimeters, while the faceplate of the stapes has a surface area of about 3.2 square millimeters. Sound waves apply force to every square inch of the eardrum, and the eardrum transfers all this energy to the stapes. When you concentrate this energy over a smaller surface area, the pressure (force per unit of volume) is much greater.
The configuration of ossicles provides additional amplification. The malleus is longer than the incus, forming a basic lever between the eardrum and the stapes. The malleus moves a greater distance, and the incus moves with greater force (energy = force x distance).
This amplification system is extremely effective. The pressure applied to the cochlear fluid is about 22 times the pressure felt at the eardrum. This pressure amplification is enough to pass the sound information on to the inner ear, where it is translated into nerve impulses the brain can understand by the cochlea.
The cochlea structure consists of three adjacent tubes separated from each other by sensitive membranes. These tubes are coiled in the shape of a snail shell. The membrane between these tubes is so thin that sound waves travel as if the tubes weren't separated at all. The stapes moves back and forth, creating pressure waves in the entire cochlea. The round window membrane separating the cochlea from the middle ear gives the fluid somewhere to go. It moves out when the stapes pushes in and moves in when the stapes pulls out.
Click here for a diagram of how this works (it 'opens out' the snail shell arrangement for clarification!)
The middle membrane, the basilar membrane, is a rigid surface that extends across the length of the cochlea. When the stapes moves in and out, it pushes and pulls on the part of the basilar membrane just below the oval window. This force starts a wave moving along the surface of the membrane. The wave travels something like ripples along the surface of a pond, moving from the oval window down to the other end of the cochlea.
The basilar membrane has a peculiar structure. It's made of 20,000 to 30,000 reed-like fibers that extend across the width of the cochlea. Near the oval window, the fibers are short and stiff. As you move toward the other end of the tubes, the fibers get longer and less rigid. This gives the fibers different resonant frequencies. A specific wave frequency will resonate perfectly with the fibers at a certain point, causing them to vibrate with a big amplitude. Because of the increasing length and decreasing rigidity of the fibers, higher-frequency waves vibrate the fibers closer to the oval window, and lower frequency waves vibrate the fibers at the other end of the membrane.
The organ of corti is a structure containing thousands of tiny hair cells. It lies on the surface of the basilar membrane and extends across the length of the cochlea.
Until a wave reaches the fibers with a resonant frequency, it doesn't move the basilar membrane very much at all. But when the wave finally does reach the resonant point, the membrane suddenly releases a burst of energy in that area. This energy is strong enough to move the organ of corti hair cells at that point.
When these hair cells are moved, they send an electrical impulse through the cochlear nerve. The cochlear nerve sends these impulses on to the cerebral cortex, where the brain interprets them. The brain determines the pitch of the sound based on the position of the cells sending electrical impulses. Louder sounds release more energy at the resonant point along the membrane and so move a greater number of hair cells in that area. The brain knows a sound is louder because more hair cells are activated in an area.
The ear responds to the vibrations that constitute sound, and these are translated into nerve signals and passed to the brain. The ear consists of three parts: outer ear, middle ear, and inner ear. The outer ear is a funnel that collects sound, directing it down a tube to the ear drum (tympanic membrane), which separates the outer and middle ear.
Sounds vibrate this membrane, the mechanical movement of which is transferred to a smaller membrane leading to the inner ear by three small bones, the auditory ossicles. Vibrations of the inner ear membrane move fluid contained in the snail-shaped cochlea, which vibrates hair cells that stimulate the auditory nerve connected to the brain. Three fluid-filled canals of the inner ear detect changes of position; this mechanism, with other sensory inputs, is responsible for the sense of balance.
When a loud noise occurs, muscles behind the eardrum contract automatically, suppressing the noise to enhance perception of sound and prevent injury. Below you can see a sectional view of the ear and a modern hearing aid.

Sound
A physiological sensation received by the ear, originating in a vibration that
communicates itself as a pressure variation in the air and travels in every
direction, spreading out as an expanding sphere.
All sound waves in air travel with a speed dependent on the temperature; under ordinary conditions, this is about 330 m/1,070 ft per second. The pitch of the sound depends on the number of vibrations imposed on the air per second, but the speed is unaffected. The loudness of a sound is dependent primarily on the amplitude of the vibration of the air. The lowest note audible to a human being has a frequency of about 20 hertz (vibrations per second), and the highest one of about 20,000 Hz; the lower limit of this range varies little with the person's age, but the upper range falls steadily from adolescence onwards.